This week our team worked on automating the functions created previously and creating visualization from sales Genie data. We also shortlisted some ACS demographic variables to display statistics about the store location in our dashboard.

We successfully completed automating the rural population function and created the metro function population. We created the Pop_Binder function, which creates a new data frame from an address with the populations for all the cities in the county, and an Address_Parser function which parsers a given address into the street, city, state, and country. The Pop_Binder and Address_Parser will likely be used in an initialization function that will run before the rest of the toolkit and save as a global variable.

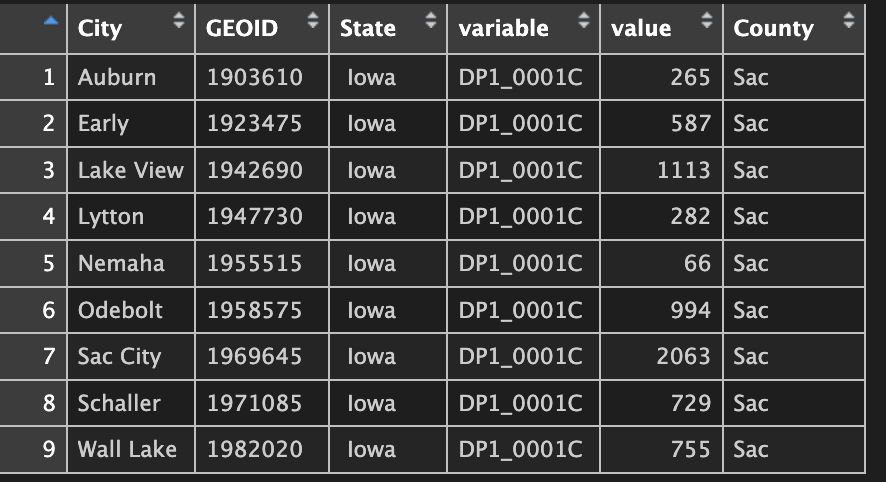
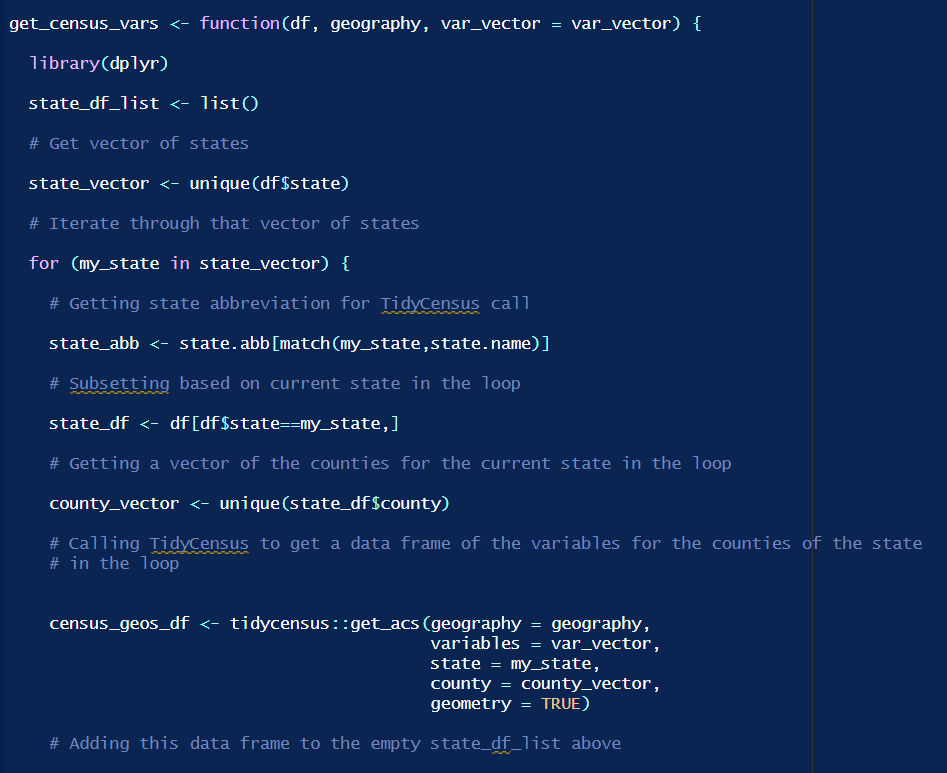
We also tried to automate the retrieval of relevant census statistics for the market area selected by a user of our tool. Careful decisions were made about the granularity and selection of the variables to use. We created a function, get_census_vars, that pulls the census data for all the variables selected.
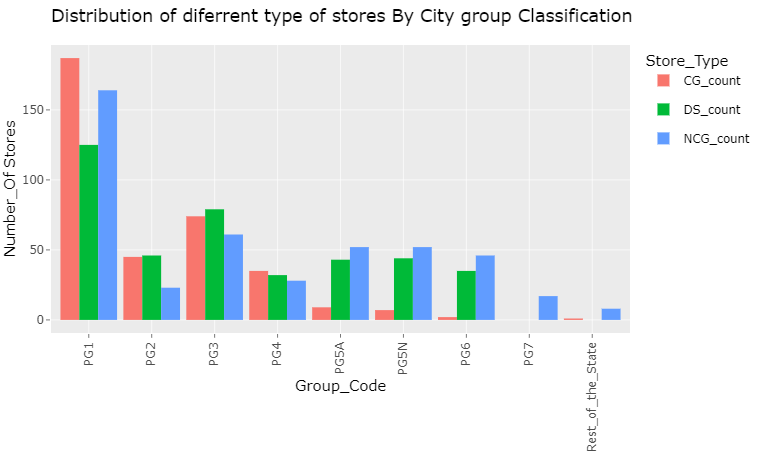
We created some visualization about the distribution of the chain non, chain grocery stores, and dollar stores for cities in different classification groups. We also cleaned some data and made the last week’s graphs more consistent.

From the above graph, we can see that smaller cities usually tend to have just non-chain grocery stores and not dollar stores or chain grocery stores.
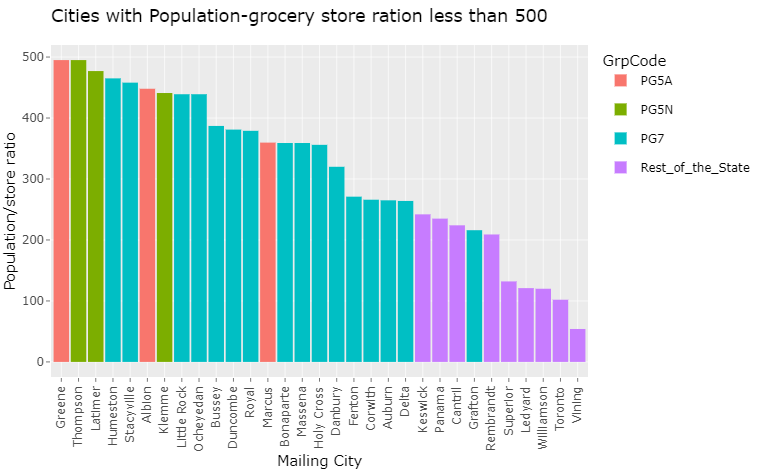
We also tried to visualize cities store distribution based on Population-Store Ratio. 
The above graph shows the cities in Iowa with 1 grocery store for at least every 500 people
Final Project Presentation Outline
We created our YouTube Trailer video for our project this week and also made a rough outline for the final project presentation. We are planning to divide our final presentations into 4 sections:
Introduction(Harun)
Project Overview:
Summary
Goal
The Excel tool
Literature Review & Data Collection:
Reading on Rural Grocery Stores
Selecting data to automate
Methods
Market Size Calculation (Alex)
Market area calculation
Quarter Circle
Voronoi
Reillys
Population
Rural Population
Metro Population
Town Population
Revenue Estimation (Srika)
Average Grocery Spend
State index and percentage price index:
Rural price parities(RUPP)
Consumer price index(CPI)
Update and Maintenance
Money spent by different categories of shoppers
Market trends
Visualization:
Non-Chain grocery store, Chain grocery store, Dollar store distribution
The RUCC Classification
City group classification
Expense Estimation (Aaron)
Expenses for Opening a Store
Cost of Goods Sold
Operating Expenses
Asset Depreciation
Loan Interest
Rent
Secondary Sources of Income
Income from interest
Other income
User-defined Inputs
Switching between multiple ownership scenarios
Input their own percentage values as sliders
The assets list can be customized to calculate depreciation
Custom loan and rent
Pre-Tax Profit Calculation
Design Choices (Harun)
Results (Harun)
- Dashboard Demo