Pct_County <- function(north_quad,east_quad,south_quad,west_quad, county_size) {
  sum_val <- sum(Quadrant_Area(north_quad),Quadrant_Area(east_quad),
                 Quadrant_Area(south_quad),Quadrant_Area(west_quad))
  return(sum_val / county_size)
}
Project Overview
Our group’s task in the 2023 DSPG program is to develop a tool for the Farm, Food and Enterprise Development ISU Extension (FFED) that can help inform decision making for rural grocery stores. The goal of the project is to help users to make better decisions in opening, inheriting, and operating grocery stores in rural environments. The development of the tool relies heavily on the research conducted by domain experts on rural grocery stores and accessibility to verified data on the topic. Our current workflow moving forward is outlined in the following manner.
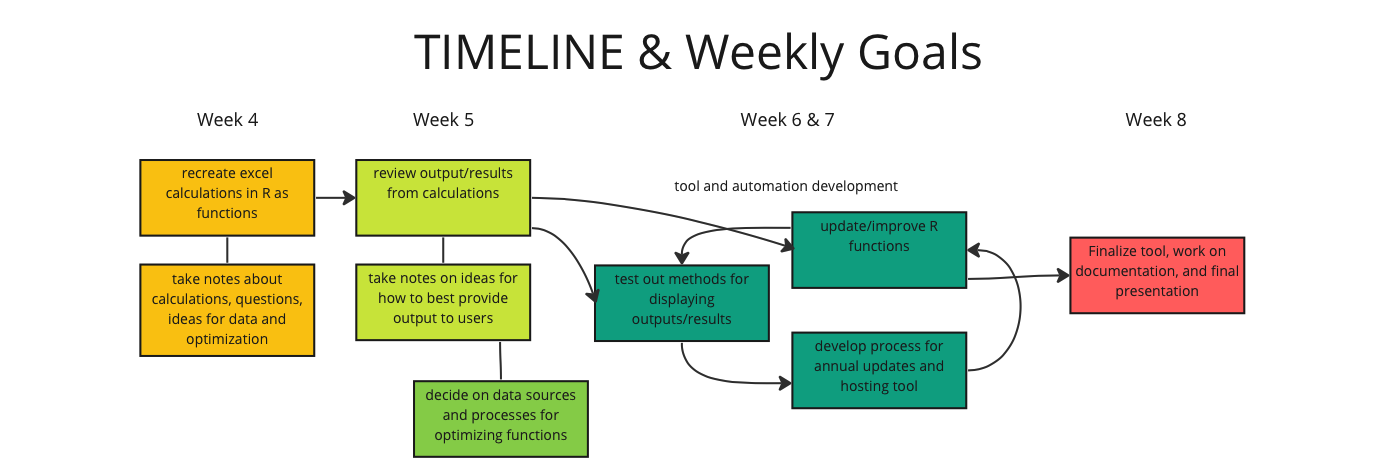
As we learn more about our data and possibilities for automating processes that our client’s initially calculated manually, we update our vision for what our final deliverable for DSPG could be. A draft of our thoughts are depicted as a tool which takes a certain range of user input and automated data, transforms that data through converted functions, and outputs the results in the most accessible format for the user.

Training and Data Discovery
Data camp training on fundamentals of R and Tableau
Reviewed:
Ownership models
Status of the grocery industry
The margin for different categories of products in a grocery store
Trends in the market
Suppliers and distributors
Support for rural grocery store setup
Reviewing the client reports understanding the key aspects of the project:
Market share - Calculates how many potential customers a store in a specific location would bring in.
Estimating the Revenue - Calculates the total revenue of the store.
Estimating Expenses - Calculating the various expenses of the store by revenue range.
Learned documentation using R oxygen.
Collecting and Evaluating the various possible data sources
Client Meeting
We had a meeting with our client where we shared our insights and got more clarity on their expectations from the project.
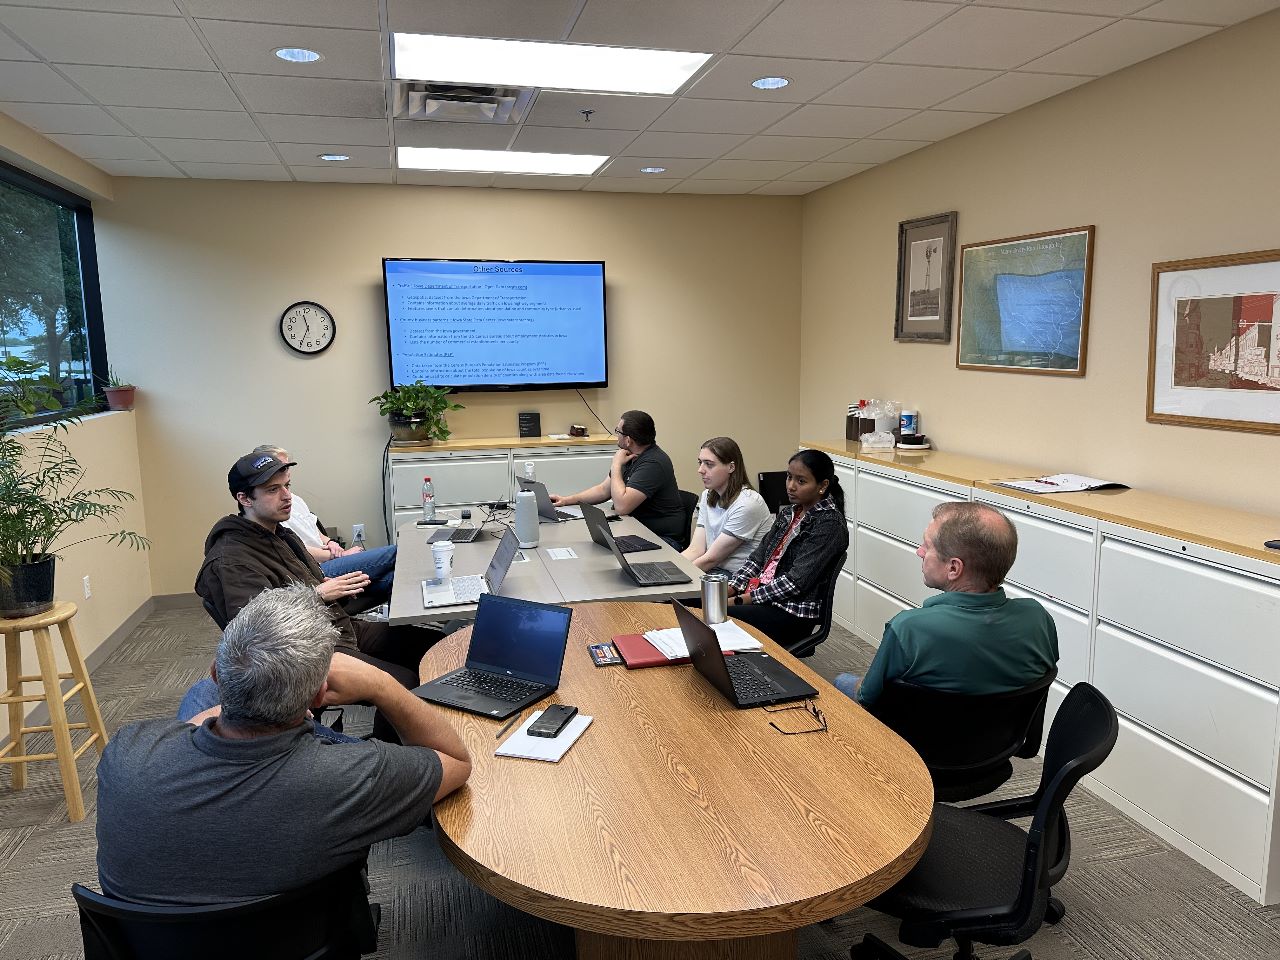
We shared the data that we collected during the first three weeks.
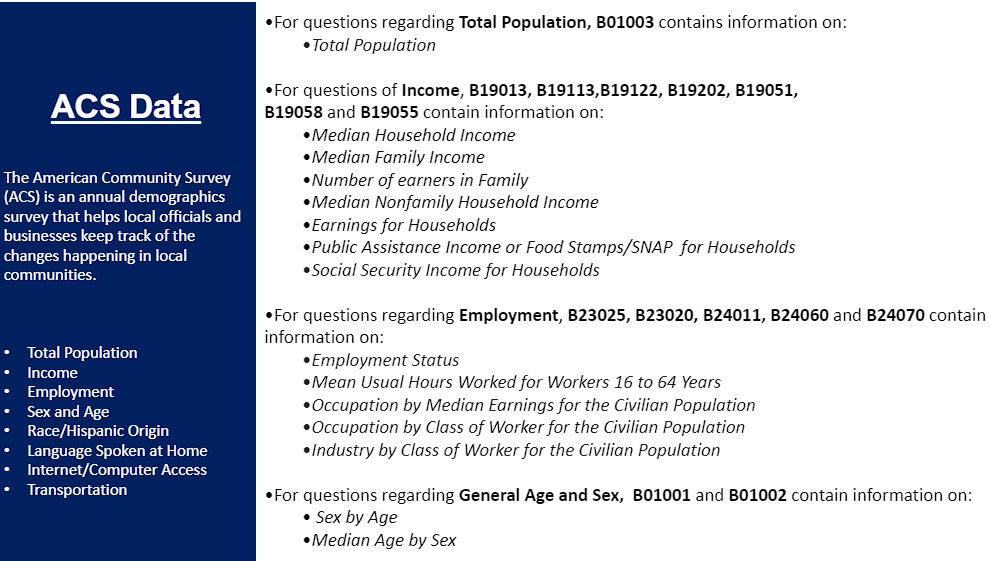
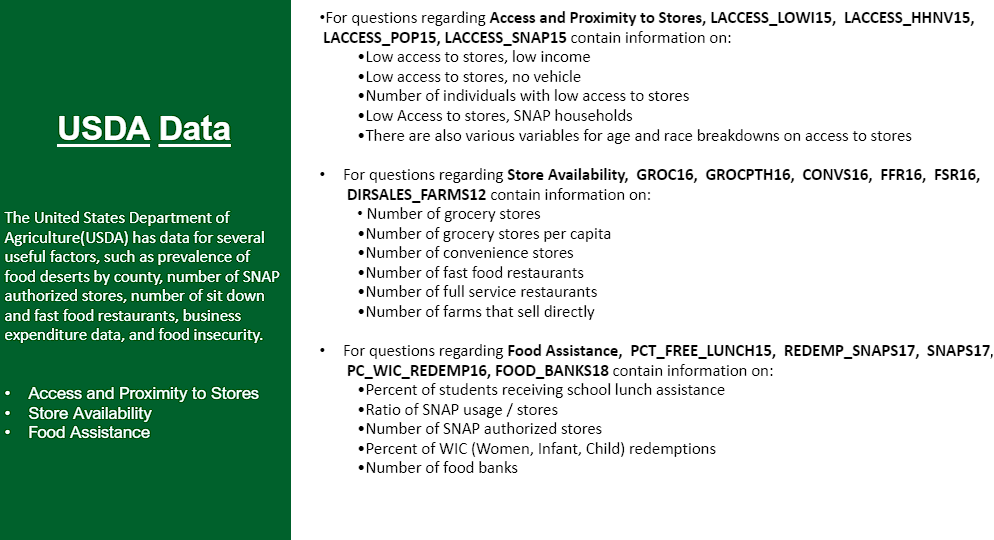
Key insights from the meeting:
We clarified the scope of the project and determined a path for moving forwards.
We learned about existing data sources, such as Bizminer and VerticalIQ, and learned more about the rural grocery business
Creating Functions
This week was primarily focused on understanding and documenting the function from our client’s Excel sheets.

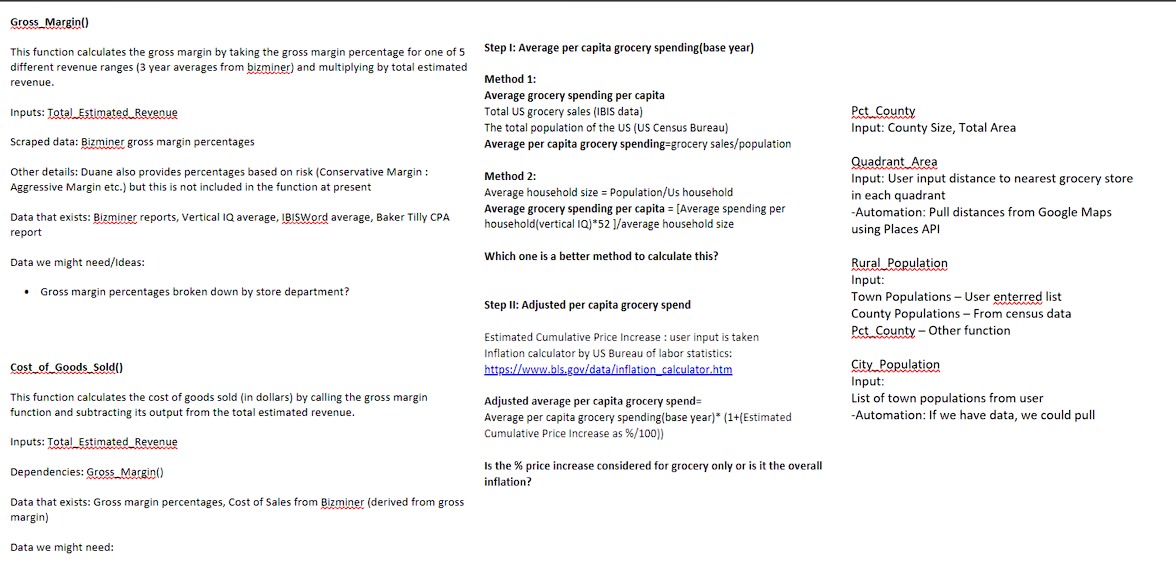
Recreating the Excel functions in R.
Using Roxygen2 to provide documentation for the functions.
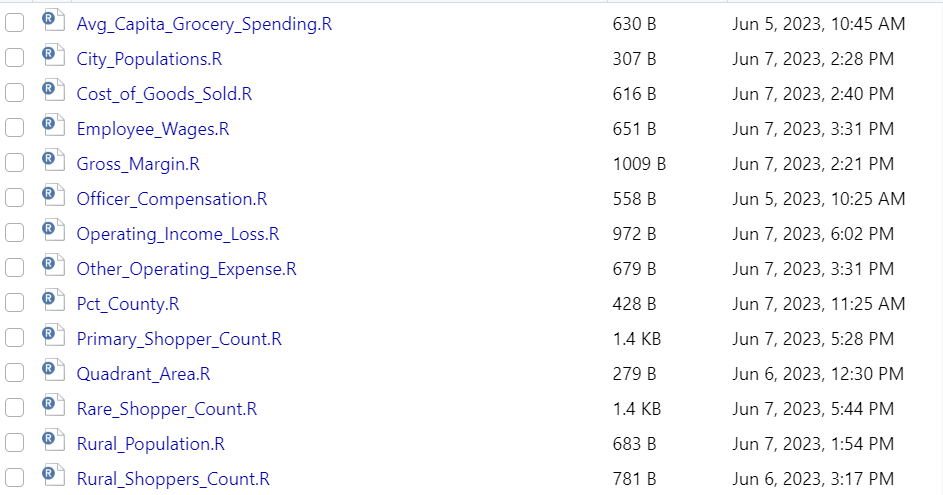
Preparing to build the DSPG Grocery package.
Alex
Created functions Estimating the Market size
Here is the code for one of the functions in that calculation:
The function Pct_County is used to calculate the percentage of the county under the proposed store.
Srika
Created functions Estimating the Total Revenue
Here is the code for one of the functions in that calculation:
The function Primary_Shopper_Count estimates the number of primary shopper from the different categories of markets like Metro,rural and towns nearby for the proposed store
Primary_Shopper_Count<-function(pct_metro_prim=50,pct_rural_prim=30
                                ,pct_town_prim=30,county_pop, towns_pop,
                                pct_county,metro_list,town_list){
  rural_pop<-Rural_Population(county_pop, towns_pop, pct_county)
  metro_pop<-City_Populations(metro_list)
  town_pop<-City_Populations(town_list)
  (metro_pop*(pct_metro_prim/100))+(rural_pop*(pct_rural_prim/100))+
    (town_pop*(pct_town_prim/100))
}
Aaron
Created functions Estimating the Expenses
Here is the code for one of the functions in that calculation:
The function Employee_Wages calculates the dollars spent on employee wages.
Employee_Wages <- function(Total_Estimated_Revenue) {

  ifelse(Total_Estimated_Revenue < 500000, stop("error: no data for this revenue range"),
         percentage <- ifelse(Total_Estimated_Revenue < 999999.99, .0789,
                              ifelse(Total_Estimated_Revenue < 2499999.99, .0934,
                                     ifelse(Total_Estimated_Revenue < 4999999.99, .0751,
                                            ifelse(Total_Estimated_Revenue < 24999999.99, .0975, .1083)))))


  Total_Estimated_Revenue * percentage
}
Work in Progress
We are going to continue on working to optimize functions further and are looking into different ways to automate the following processes in the coming week.
- Data retrieval processes.
- Spatial integration with Google Maps.
- Tableau and R interactivity.
- Report summaries with NLP.